We live in a world of data where almost anything can be monitored to help improve performance, from racing drivers trying to find that "perfect" lap to manufacturers monitoring processes. Everyone is using data to their advantage and this might include your competitors in the business world too, there's so much data available in the business world and even more so when it comes to digital marketing but where can you start with getting an upper hand?
Start with your website traffic
Whether you're computer minded or not "data" can sound daunting, the key is to start with the obvious things first and for small businesses with a website the best place to start is with your website traffic. You can learn so much about what you're doing right or where you might need to improve from your existing users and this is informtaion you can get for FREE so why wouldn't you use it.
Google Analytics should be your best friend
You might have heard of Google Analytics before, you might not have, but either way this platform should be your best friend. As a basic version it's completely free to use and easy to set up on most website platforms too (we'll get on to that later), once it's collecting information Google Analytics can tell you everything from how many people are visiting your website, where they come from, what they're doing and much more besides.
If you're wondering how this information might be helpful, lets look at the 3 examples above:
- How many people are visiting your website
- Can help you decide if you need to advertise
- If seasonal trends are affecting your business
- Where visitors arrive from
- Where are users finding your website
- Are you looking in the right places for customers
- What users are doing on your website
- Are they looking at one page then leaving
- Do users leave at a certain point when trying to buy
All of the above examples present brilliant opportunities, as a business owner you can then use this insight to make positive changes to improve how your users and customers engage with your business which should lead to improved performance (sales).
What are the essentials to monitor
One of the benefits of a platform such as Google Analytics is the sheer volume of information which you can access and analyse about how your users are interacting wth your website or app. While this can be avantageous, if you're new to using this kind of data, having some essentials to monitor can be a really good place to start.
But what are the essentials? A great place to start is by monitoring how users are finding your website and interacting with it, this information will help you learn where people are finding your business, such as through social media, search engines etc and what content (products, blogs etc) are being viewed once there.
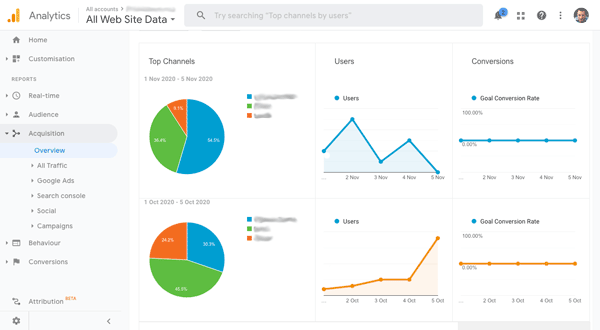
A great place to start is with the acquisition overview which shows you where your website traffic has come from and the behaviour overview (link) which shows you which pages of your website people have viewed.
What can this information tell you?
Once you know how people are finding your business (acquisition overview), you can make better choices about where and how to attract new website visitors. As an example if you've just run a social media advert but didn't see an increase in your website traffic from social media then you know that your advert hasn't worked and needs rethinking.
On the other hand, if you can see a lot of website users are viewing a certain type of content on your website (behaviour overview) then this could tell you what type of content your users like to read. This would suggest similar content would appeal to your website visitors in future.
Here's an quick look at the information in each of these reports:
It's this information that can help you top make more informed descisions about your digital marketing, here's an overview of some of the key numbers and what they can tell you:
- Users
- The number of individuals who have been to your website
- User volumes help understand if users are finding your website
- Looking at user volumes by channel tells you where users are finding your website
- Sessions
- The total volume of visits to your website from your users
- A higher number of sessions to users suggests people are coming back to your website
- Sessions are also used to calculate conversion rate
- Avg. session duration
- The average amount of time a visit lasted
- A high average suggests users are reading your content and engaging
- A low average isn't always bad and could suggest users find what they want quickly
- Bounce rate
- As a percent, the amount of sessions where a user visited one page and then left
- High bounce rates can suggest that users aren't exploring your website
- This could suggest they found what they need or navigation isn't clear
- Exit rate
- The percent of sessions which are ended on a given page
- High exit rates could suggest that users have found all the detail they need
- If seen in a checkout flow however, this could suggest users are struggling to convert
One of the most important things to remember is that no single measure should be used in isolation as this can lead to false positives or misinterpretation of the data.
How to set up Google Analytics
For the most part, setting up Google Analytics on most website content management systems (CMS) is straight forward and can be achieved with a quick copy and paste, giving you access to insight in minutes.
First you'll need to create an account, website or app proprty and reporting view and Google has some excellent support to help you do this here.
Below you can find some guides to setting up Google Analytics on the most common platforms:
Get Help Setting Up Google Analytics
If you're not comfortable setting up Google Analytics on your website, get in touch and we'll get GA running on your website for just £20.


